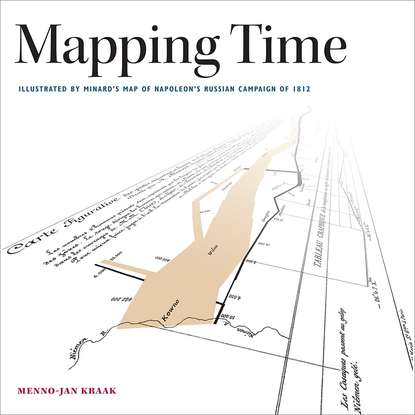
The map bears no legend that people would generally understand, however, the extensive text below the title takes its place. Explaining the width of the flow line, it states: “The number of men present are represented by the width of the colored zones at a rate of one millimeter for every ten thousand men; they (the numbers) are additionally written across the zones.” In the maps in figures 2-1 and 2-2, this scale is no longer correct, because both have been reduced from their original size (63 × 25 cm), however, the numbers written along the segments mitigate the problem this creates. Moreover, the line’s colors communicate information about direction: “red” (which appears orange in figure 2-2) indicates east into Russia, while black indicates west out of it. Minard also describes his data sources, in the same text block, something that unfortunately doesn’t always appear on today’s maps. He writes: “The information which has served to draw up the map has been extracted from the works of M.M. Thiers, of Ségur, of Fezensac, of Chambray and the unpublished diary of Jacob, pharmacist of the army since October 28th.”
Minard even inserts some of his design decisions: “In order to better judge with the eye the diminution of the army, I have assumed that the troops of Prince Jérome and Marshal Davout, who had been detached at Minsk and Mahilyow (today Mogilev) and had rejoined (Napoleon) around Orsha (Orscha) and Vitebsk (Vitsyebsk), had always marched with the army.” This decision certainly must have contributed to Tufte’s admiration: “Graphic elegance is often found in simplicity of design and complexity of data” (Tufte 1983, p. 177). Simplicity may bring elegance but, it also sometimes means that information has been sacrificed. Sometimes, a complex design cannot be avoided, however. Today’s digital environment allows for visualization strategies that help to overcome a reader’s difficulties. A scale bar in the lower right of the map, indicating the map scale, completes the legend (the map measures distance based on the French league, which equals approximately 4 kilometers).
Figure 2-2. A translated and redrawn version of Minard’s map of the French invasion of Russia in 1812. At the top of the map, below the title, a body of text explains the data and symbols used. The orange line shows the path of the army’s march to Moskva, while a gray one tracks their retreat. Below, a red diagram links to the gray path in order to relate temperature to the events of Napoleon’s retreat. Blue marks the rivers, which perform a geographic function in the flow map, and black the place names.
The third step calls on readers to interpret the map itself. As with any thematic map, some basic topographic information is required to orient the theme in space. Here, rivers and place names provide the geographic parameters: Along the western edge is the Neman River, where Napoleon’s campaign began and ended; along the eastern edge, the Moskva River in the east; in the center is the Berezina River, which played a prominent role in the Grand Army’s retreat. East of the Berezina, the map displays but does not label the Dnjepr River. It provides about twenty toponyms—among them Kaunas in the west, Moskva in the east, and Minsk and Smolensk in the center—but adds no symbol to plot their location, leaving their exact location vague. For the map’s theme, Minard reserved the flow lines, inscribing absolute numbers at selected places along the line in order to reinforce the size of Napoleon’s army represented in the flow line.
Time performs an intrinsic function in flow maps, although exact time references rarely occur. Only the diagram at the bottom of the map indicates the time factor in Napoleon’s retreat. It also denotes temperature and links it to both date and location. A quick glance at the study can show, for example, that Napoleon’s army crossed the Berezina River on November 28, when the temperature measured minus 20 degrees Réaumours, equivalent to minus 25 degrees Celsius.
Napoleon crossed the River Neman into Russia with 422,000 troops, and crossed it back into Poland with only 10,000. The flow map expresses this disastrous outcome very clearly. However, it does not explain why the disaster occurred. The temperature diagram tempts readers to conclude that the cold created the calamity. Many paintings of the campaign support this, with their stark depictions of soldiers succumbing to the harsh winter weather (see, for instance, chapter 3, figure 3-1). However, scrutiny of the map reveals that the largest drop in troop numbers occurred on the march toward Moskva, which took place during autumn. Did battle, desertion, or illness cause these losses (Talty 2009)? The map does not indicate the most important battles so it is hard to answer this question. Chapter 6, which describes analytical mapping tools, deals with these kinds of questions in greater depth.
Minard lived in a time when people “invented” many statistical graphics and thematic maps. The next section describes his role in this development.
Figure 2-3 zooms in on some of the map’s details. The section of the map in figure 2-3a displays the Neman River and its surrounding territory where the invasion both started and ended. It is the most dramatic aspect of the map because it shows the big difference between the number of soldiers at the start and end of the campaign. It also demonstrates the problems that a reader might have when faced with the geographical names. Most atlases today apply the so-called local place-name policy, which marks geographical names according to local spelling. Minard’s map, by contrast, uses a combination of French and German names, which can confuse readers unfamiliar with historical toponyms.
In general, this book follows local place policy. In exceptional situations, however, alternative spellings have been allowed if people still widely use it. Take, for example, the city of Tilsit in former East Prussia. Today, it belongs to Russia as Sovetsk. In other cases, places changed their name without changing countries, like the town of Ghat, renamed Gagarin in 1968 in honor of the world’s first man is space. Figure 2-5 lists variations for the most important places listed in the campaign area.
Figure 2-3b shows Moskva. This portion of the map highlights an interesting absence of time, because Minard did not clarify here the fact that Napoleon stayed in Moskva for about a month. This omission is important, because the flow line alone gives readers the misleading impression that the army moved at a uniform rate. Dates could have been added (see examples of this in figures 2-18, 2-20, or 2-21), although other forms of graphic representations might be more expressive (see chapter 5). Minard also makes some curious choices of places to map. The center of this map detail, for example, shows the town of Mozhaysk. Just west of this town, the segment of the flow line that moves toward Moskva shows a reduction of almost 30,000 troops. This happens because the Battle of Borodino, the largest battle of the campaign, occurred here, in the little village 10 kilometers west of Mozhaysk. Adding this name may have improved Minard’s map.
Figure 2-3c displays the losses that the French army suffered while crossing the Berezina River. Napoleon’s troops shrank by almost half (see also chapter 6, figure 6-7). This detail exemplifies how well Minard used geography to communicate his statistics. According to cartographer Arthur H. Robinson (1967), Minard demonstrated “cartographic ingenuity” when it came to using cartographic symbolization to get his message across. The basemap provides needed geographic context yet can adapt to the theme’s constraints. That is why Minard often called his maps “Carte figurative et approximatives.” Curiously, he did not add the term “approximatives” to his map’s title. Looking at the detailed representation of the rivers, it is easy to understand why. At the same time, the level of thematic data generalization in this map lessens the need for a detailed topography. For example, names loosely indicate the geographic location of towns. This can be misleading. Is Studianka to be found to the east or west of the river? Actually, it is east, though the map does not say. In contrast, Minard has drawn the rivers in his map in great detail, in comparison to the rectangular segments that illustrate the flow of Napoleonic soldiers through Russia.
The detail in figure 2-3d shows the scale bar and part of the temperature diagram used in Minard’s map. When he made his map, France still used its own Réaumur temperature scale. Its zero degree indicates the same temperature as that on the Celsius scale. Measurements