3.5 Temporal data visualization and time-space
Change from object perspective
Change from attribute perspective
Change from location perspective
Change and Minard’s representation of Napoleon’s Russian campaign
5.4 Change in a series of maps
6 Maps and temporal exploration
6.1 From presentation to exploration
Examining Napoleon’s battle record
What happened at the crossing of the Berezina River?
Preface
How do we map time? That has been the overriding question guiding my research. Questions about mapping time challenge us to go beyond the conventional snapshot-based approach to maps in order to incorporate processes. Such a task requires a different view of maps now that technological advancements have made time-related data so abundant. We need new approaches to this data that will enrich our knowledge about spatiotemporal patterns and relations and their implications for the real world. Indeed, how we conceptualize mapping time will fundamentally shape how we understand the data and how we present our findings to various audiences.
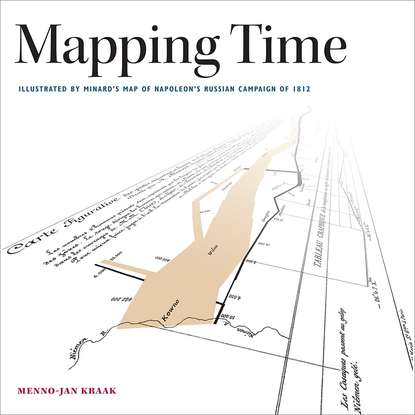
Minard’s map of Napoleon’s Russian campaign in 1812 has played a role in my career ever since my research interests in mapping time matured. Many claim that this might be the best map ever made. It is worth challenging the truth of such a statement, which many of my former students have done in the course of their research. It would be easy to refute the claim, of course, because every situation demands its own map so, in my view, there cannot be a single best map.
Almost all of the book’s illustrations—over 110 in all—relate either directly or indirectly to the Russian campaign. The dataset supporting my analysis of Minard’s map has expanded significantly over the years. My growing interest in the French invasion has led me to amass a large repository of data, including many shelves of books, maps, and games related to this event. Therefore, the examples in the figures derive from genuine data found in literature. Nevertheless, one has to realize that there are many interpretations of the truth out there; readers will have to come to their own conclusions about mine.
My interest in this part of European history is, in part, personal. My father’s research into our family tree revealed the fact that, five generations ago, Gerrit Janz Kraak, the brother of my grandfather’s great-grandfather, took part in the Russian campaign as a soldier in Napoleon’s army. He died in Russia, at the battle on the Berezina River (now in Belarus), on November 27, 1812. This explains why the battle features prominently in so many of the book’s examples.
This book’s adventure began with my first sabbatical in 2011. The free time gave me the opportunity to visit the French military archives so that I could find proof of my ancestor’s misfortune on the banks of the river in Belarus where the French army crossed. A publishing deal with Esri Press luckily materialized at this time.
Although I am the sole author of this book, I know that we never really write a book on our own. The task requires many contributors. The greatest demand fell on my family, who had to get used to the phrase: “No time, have to work on the book.” Patiently, they endured. Thanks to Marijke, Eelke, Laura, and Emma.
Many of my students contributed to the datasets that I used to create the book’s illustrations. Staff members of my research groups contributed as well. Bas Restios created the software that made some of the illustrations possible, while Willy Kock processed the complex data. Discussions with Connie Blok and Corne van Elzakker helped to improve the chapter on maps.
Three people deserve a separate word of thanks. First, Irma Kveladze did most of the work preparing the Napoleon-related data for the flow maps and space-time cube. Although she used this dataset in her own doctoral research, my requests